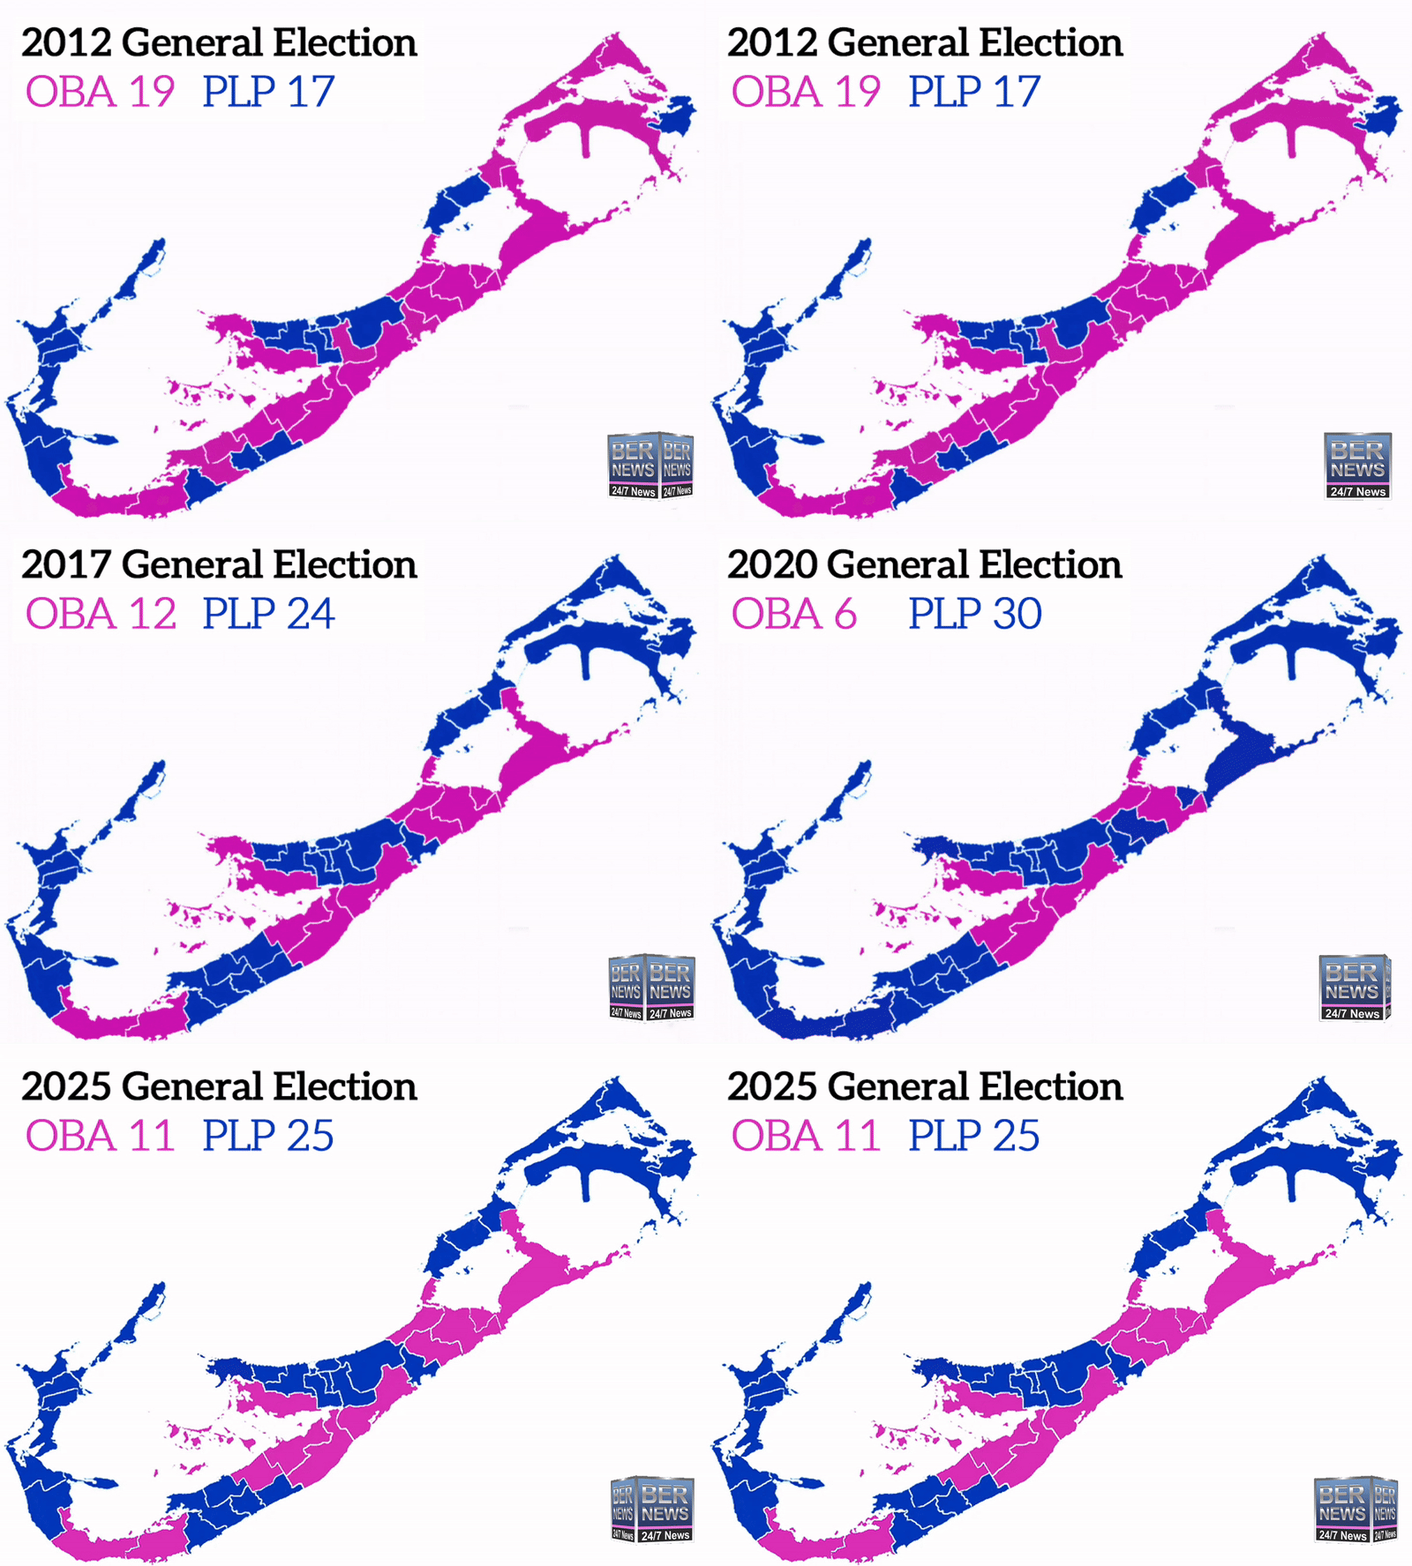
The maps below shows a general outline of the 36 electoral constituencies that Bermuda is divided into; blue represents the PLP and pink the OBA. The animated image below shows the changes in the 2012, 2017, 2020, and 2025 General Elections.

The interactive map below shows the winners in the 2025 General Election, the blue areas were won by the PLP [25] in 2025, and the pink areas were won by the OBA [11] in 2025. If you click on the icons, it will show the winners and candidates for each seat, and if you click on the link provided in the pop up chart, it will take you to a page with comprehensive information, including past results in the area which can help to provide context.
2020 General Election Results Map| Click here to see
The interactive map below shows the results following the 2020 General Election, the blue areas were won by the PLP [30], and the pink areas were won by the OBA [6]. If you click on the icons, it will show the winner and candidates for each seat, and if you click on the link provided in the pop up chart, it will take you to a page with comprehensive information.
2020 General Election Seat Change Map| Click here to see
The interactive map below shows the five seats that changed parties following the 2020 General Election, with five seats changing from the OBA to the PLP. If you click on the icons, it will show the winning candidates in the seats.


